
Comparison of the effects of different teaching methods on the effectiveness of teaching neurology in China: a bayesian network meta-analysis and systematic review | BMC Medical Education

Study characteristics
The literature retrieval process is shown in Fig. 1. Initially, 1707 relevant articles were obtained based on the search strategy, and after deduplication, 31 articles were selected. The basic characteristics of the literature are shown in Table 1, including a total of 2,124 research subjects, with 1,062 cases in both the experimental and control groups.
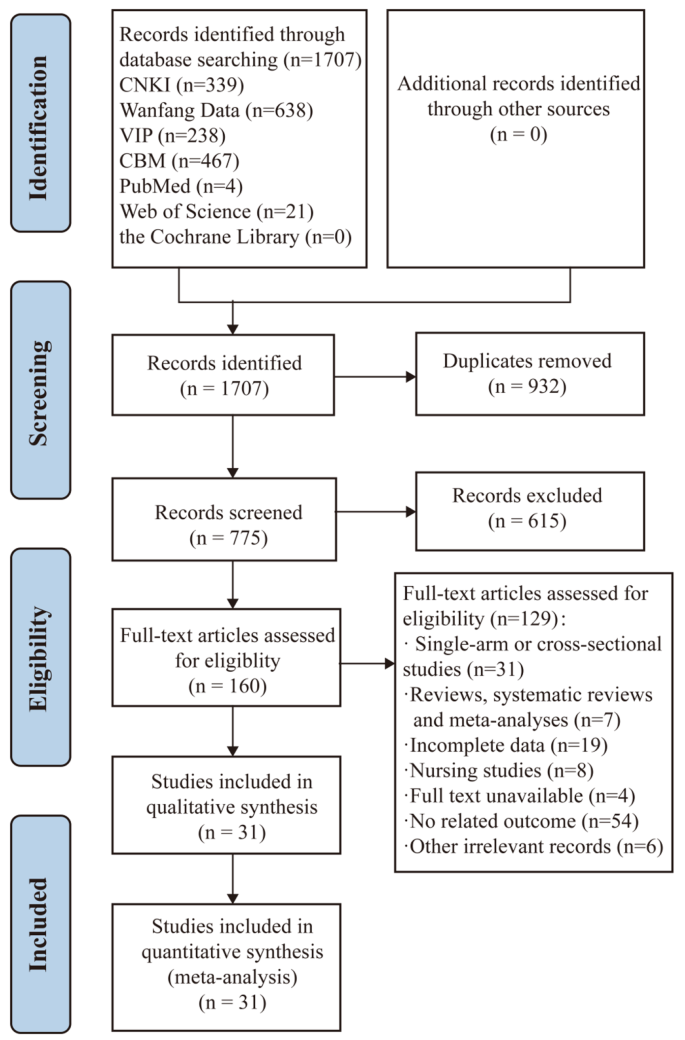
Flowchart of the literature search
Risk assessment
The risk assessment of the included literature is shown in Fig. 2. A detailed ratings for each study is at Supplementary Table S2. Among the included articles, 17 studies employed the random number table method, 1 study utilized the random drawing method, and an additional study employed the odd-even month random method.

Risk of bias graph of the included RCTs. The vertical axis represents the risk of bias items, and the horizontal axis represents the percentage of the number of RCTs
Network meta-analysis result
The evidence network of outcome indicators is presented in Fig. 3. The results indicate that theoretical exams and practical skill scores involve 30 and 27 direct comparisons, respectively, all of which are two-arm trials and have not formed a closed loop.

Network diagrams for different outcomes. (a) the theoretical exam scores; (b) the practical skill scores. The blue dots represent the different teaching methods, the larger the blue dot the larger the sample size. The line between the blue dots represents literature with direct comparisons, the thicker the line the larger the sample size containing direct comparisons
Compared to the LBL teaching method, various alternative teaching methods, including CBL, PBL, TBL, FCM, and EBM, exhibit a significant enhancement in theoretical exam scores. Notably, CBL demonstrated the most substantial impact [MD = 13.12, 95% CI (9.78,16.42), P < 0.001], followed by the PBL teaching method [MD = 7.79, 95% CI (4.83,10.76), P < 0.01], TBL teaching method [MD = 7.51, 95% CI (1.82,13.24), P < 0.001], FCM teaching method [MD = 6.48, 95% CI (1.83,11.15), P < 0.001], and EBM teaching method [MD = 6.28, 95% CI (0.69,11.86), P < 0.001]. In comparison to PBL, FCM, EBM, and CP teaching methods, the CBL teaching method emerges as significantly more effective in improving theoretical exam scores. Notably, the impact was most pronounced when compared to the CP teaching method [MD = 10.64, 95% CI (3.21,18.02), P < 0.001], followed by the EBM teaching method [MD = 6.83, 95% CI (0.36,13.35), P < 0.001], FCM teaching method [MD = 6.64, 95% CI (0.86,12.35), P < 0.001], and PBL teaching method [MD = 5.32, 95% CI (0.84,9.76), P < 0.001]. Figure 4 (a) illustrates the results of the network meta-analysis, showcasing the comparative effectiveness of different teaching methods. The ranking evaluation, detailed in Table 2; Fig. 4 (b), places the teaching methods in the following order: CBL > PBL > TBL > FCM > EBM > CP > LBL.

Mean difference (95% credible interval) and surface under the cumulative ranking curve (SUCRA) plots for different outcomes. a and b represent theoretical exam scores, while b and d represent practical skill scores. “**” in Fig. 4 (a, c) indicates statistical significance (P < 0.05). The vertical axis in Fig. 4 (b, d) represents cumulative probabilities, and the horizontal axis represents rank
Compared to the LBL teaching method, various alternative teaching methods, including CBL, PBL, TBL, FCM, and EBM, also display a significant enhancement in theoretical exam scores. In particular, EBM demonstrated the most notable effect [MD = 13.34, 95% CI (7.59,18.95), P < 0.001], followed by the CBL teaching method [MD = 12.90, 95% CI (10.24,15.54), P < 0.01], PBL teaching method [MD = 10.23, 95% CI (7.82,12.69), P < 0.001], TBL teaching method [MD = 6.94, 95% CI (2.72,11.16), P < 0.001], and FCM teaching method [MD = 6.36, 95% CI (2.78,9.94), P < 0.001]. In comparison to the TBL teaching method, the CBL teaching method significantly enhances practical skill scores [MD = 5.96, 95% CI (0.97,10.94), P < 0.001]. When compared to the FCM teaching method, the EBM teaching method had the most noticeable effect on improving teaching performance skills [MD = 6.98, 95% CI (0.24,13.60), P < 0.001], followed by the CBL teaching method [MD = 6.53, 95% CI (2.09,10.97), P < 0.001]. Compared to the CP teaching method, the EBM teaching method had the most noticeable effect on enhancing teaching performance skills [MD = 9.92, 95% CI (2.26,17.41), P < 0.001], followed by the CBL teaching method [MD = 9.47, 95% CI (3.83,15.12), P < 0.001] and then the PBL teaching method [MD = 6.81, 95% CI (1.30,12.39), P < 0.001]. Figure 4 (c) presents the results of the network meta-analysis, offering a comparative perspective on the effectiveness of different teaching methods. The ranking evaluation, detailed in Table 2; Fig. 4 (d), positions the teaching methods as follows: CBL > EBM > PBL > TBL > FCM > CP > LBL.
Publication bias
The results of Begg’ tests suggested no publication bias in the included studies. The comparison-adjusted funnel plots for each outcome were shown in Fig. 5. The points in the funnel chart were asymmetric based on the position of the centerline, and the scatter was found to be symmetrical along the null line to the left and right, indicating that there was no small sample effect and publication bias in theoretical exam scores (Fig. 5 (a), P = 0.060), and practical skill scores (Fig. 5 (b), P = 0.348).

Funnel plots for different outcomes. (a) the theoretical exam scores; (b) the practical skill scores
link


