
Efficacy of problem-based learning combined with case-based learning versus lecture-based learning in orthopedic education: a systematic review and meta-analysis | BMC Medical Education

Study selection and basic characteristics
A systematic search of databases identified 453 studies, which were screened down to 161 after removal of duplicates and exclusion of irrelevant studies. Further screening based on titles and abstracts shortlisted 52 studies, which underwent full-text review and rigorous screening according to inclusion/exclusion criteria, yielding 15 studies (Fig. 1). Of these, 14 were RCTs and 1 was a Q-RCT. All studies were published between 2016 and 2025, with a total of 980 participants enrolled (490 in the experimental group using the PBL + CBL teaching model and 490 in the control group using the LBL teaching model). Among the 15 included studies, 4 targeted clerks as teaching subjects, 5 focused on interns, and 6 were conducted with residents as teaching subjects. Baseline characteristics of the included studies are summarized in Table 2.
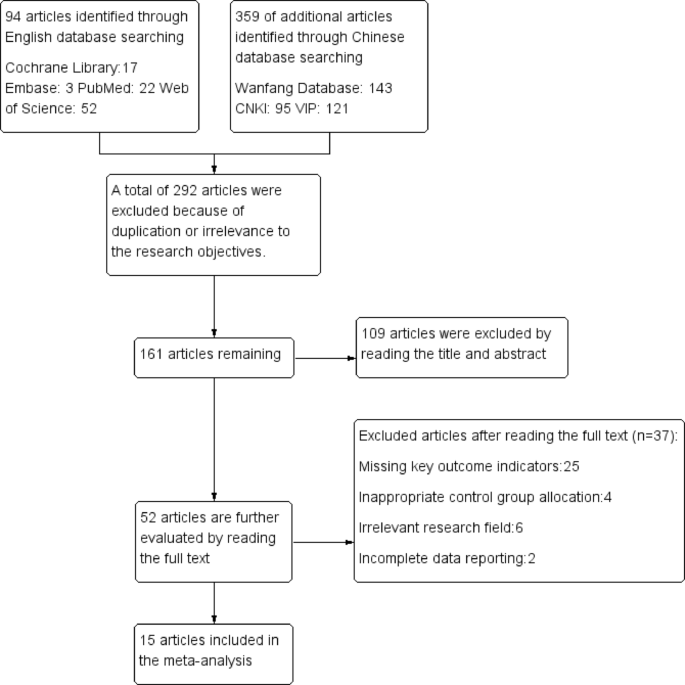
The PRISMA flow chart of the literature selection for the meta-analysis
Assessment of risk bias
A systematic review of the included studies was conducted using the Cochrane Risk of Bias Assessment Tool (Figs. 2 and 3). Among these, one Q-RCT study was classified as having a high risk of bias in random sequence generation and an uncertain risk of bias for allocation concealment, as it implemented odd-even grouping based on admission examination scores before random allocation. The remaining studies demonstrated good performance in terms of random sequence generation and allocation concealment. However, blinding of participants and personnel, as well as blinding of outcome assessment, were generally inadequate, potentially due to the interactive nature of the educational intervention and some subjective scoring criteria. The risk of bias related to incomplete outcome data and selective reporting was low, and the risk of other biases was also low. Overall, most of the included studies demonstrated low bias risk and high methodological quality.


Theoretical scores
A total of 920 students from 14 studies comparing the PBL-CBL group with the LBL group were included to assess differences in theoretical scores [2, 30,31,32,33,34,35, 37,38,39,40,41,42,43]. The PBL-CBL group demonstrated significantly higher theoretical scores than the LBL group (SMD = 1.46, 95% CI: 1.15–1.78, P < 0.0001, I2 = 77%) (Fig. 4). Publication bias was assessed via funnel plot visualization (Fig. 5) and Egger’s test was performed using Stata 16.0 software. The test suggested that there was publication Bias in 14 included studies (intercept = 6.70, t = 4.88, P < 0.001, 95% CI: 3.70–9.70) (Figs.S1 and S2). Subgroup analysis of the teaching subjects, sample sizes, and publication year revealed that heterogeneity was 47.6% (moderate heterogeneity) in groups when sample sizes ≥ 80, while it reached 77% in groups when sample sizes < 80. This suggests that smaller sample sizes may be a source of heterogeneity. Subgroup analysis of the remaining two indicators showed that high heterogeneity persisted, indicating these two indicators are not the primary factors contributing to heterogeneity (Table 3 and Fig. S3). Further sensitivity analysis, performed by sequentially removing individual studies, demonstrated that the change in heterogeneity after deleting any single study was insignificant, and the point estimate of the combined effect size remained within the 95% CI of the total combined effect size, suggesting good overall stability (Fig. 6). Finally, the trim-and-fill analysis (with 5 virtual studies added) was used to assess the impact of publication bias on the meta-analysis results (Figs. 7 and S4). Before trimming, the heterogeneity test yielded Q = 58.692 (P < 0.001), with a random-effects model pooled effect size of SMD = 1.489, 95% CI (1.171–1.807). After trimming, the heterogeneity test yielded Q = 117.63 (P < 0.001), and the random-effects model pooled effect size was SMD = 1.121, 95% CI (0.772–1.470). The results show that although the effect size decreased after trimming, the 95% CI did not include 0, and the direction of effect did not reverse. This indicates that publication bias had a limited influence and the conclusions are robust. In summary, despite significant heterogeneity, the results retain reference value.

Forest plot of the effect of the PBL-CBL group versus LBL group on theoretical scores

Funnel plot of the effect of the PBL-CBL group versus LBL group on theoretical scores

Sensitivity analysis of the effect of PBL-CBL versus LBL on theoretical scores

Trim and Fill analysis results for PBL-CBL versus LBL on theoretical scores
Practical skills scores
A total of 760 students from 12 studies comparing the PBL-CBL group with the LBL group were included to assess differences in practical skills scores [2, 30,31,32,33, 35, 37, 38, 40,41,42,43]. The PBL-CBL group was found to perform significantly higher than the LBL group in practical skills scores (SMD = 1.53, 95% CI: 1.07-2.00, P < 0.0001, I2 = 87%, Fig. 8). Publication bias was assessed via funnel plot visualization (Fig. 9) and Egger’s test was performed using Stata 16.0 software. The test suggested that there was publication Bias in 12 included studies (intercept = 8.92, t = 4.07, P = 0.002, 95% CI: 4.03–13.82) (Figs.S5 and S6). Subgroup analysis of the teaching subjects, sample sizes, and publication year revealed that heterogeneity was 13.4% (low heterogeneity) in groups when sample sizes ≥ 80, while it reached 90.5% in groups when sample sizes < 80. This suggests that smaller sample sizes may be a source of heterogeneity. Subgroup analysis of the remaining two indicators showed that high heterogeneity persisted, indicating these two indicators are not the primary factors contributing to heterogeneity (Table 4 and Fig. S7). Further sensitivity analysis, by sequentially removing individual studies, demonstrated that the change in heterogeneity after deleting any single study was insignificant, and the point estimate of the combined effect size remained within the 95% CI of the total combined effect size, suggesting good overall stability (Fig. 10). Finally, the trim-and-fill analysis (with 3 virtual studies added) was used to assess the impact of publication bias on the meta-analysis results (Figs. 11 and S8). Before trimming, the heterogeneity test yielded Q = 90.320 (P < 0.001), with a random-effects model pooled effect size of SMD = 1.558, 95% CI (1.084–2.032). After trimming, the heterogeneity test yielded Q = 167.308 (P < 0.001), and the random-effects model pooled effect size was SMD = 1.104, 95% CI (0.566–1.641). The results show that although the effect size decreased after trimming, the 95% CI did not include 0, and the direction of effect did not reverse. This indicates that publication bias had a limited influence and the conclusions are robust. In summary, despite significant heterogeneity, the results retain reference value.

Forest plot of the effect of the PBL-CBL group versus LBL group on practical skills scores

Funnel plot of the effect of the PBL-CBL group versus LBL group on practical skills scores

Sensitivity analysis of the effect of PBL-CBL versus LBL on practical skills scores

Trim and Fill analysis results for PBL-CBL versus LBL on practical skills scores
Physical examination scores
A total of 202 students from 3 studies comparing the PBL-CBL group with the LBL group were included to assess differences in physical examination scores [30, 37, 39]. The PBL-CBL group had significantly higher physical examination scores than the LBL group (SMD = 1.64, 95% CI: 0.83–2.44, P < 0.0001, I2 = 82%) (Fig. 12A).

Forest plot of the effect of the PBL-CBL group versus LBL group on (A. physical examination scores; B. case analysis scores; C. plaster immobilization skills; D. debridement technique proficiency; E. aseptic awareness; F. self-learning ability)
Case analysis scores
A total of 248 students from 4 studies comparing the PBL-CBL group with the LBL group were included to assess differences in case analysis scores [2, 30, 31, 41]. The PBL-CBL group demonstrated significantly higher case analysis scores than the LBL group (SMD = 1.30, 95% CI: 0.65–1.95, P < 0.0001, I2 = 81%) (Fig. 12B).
Plaster immobilization skills
A total of 100 students from 2 studies comparing the PBL-CBL group with the LBL group were included to assess differences in plaster immobilization skills [36, 39]. The PBL-CBL group demonstrated significantly better mastery of plaster immobilization skills than the LBL group (SMD = 2.42, 95% CI: 1.89–2.95, P < 0.0001, I2 = 40%) (Fig. 12C).
Debridement technique proficiency
A total of 100 students from 2 studies comparing the PBL-CBL group with the LBL group were included to assess differences in debridement technique proficiency [40, 43]. The PBL-CBL group demonstrated better debridement technique proficiency than the LBL group (RR = 1.44, 95% CI: 1.15–1.80, P = 0.001, I2 = 0%) (Fig. 12D).
Aseptic awareness
A total of 100 students from 2 studies comparing the PBL-CBL group with the LBL group were included to assess differences in aseptic awareness [40, 43]. The PBL-CBL group demonstrated significantly better aseptic awareness than the LBL group (SMD = 1.58, 95% CI: 1.17–2.12, P = 0.003, I2 = 0%) (Fig. 12E).
Self-learning ability
A total of 296 students from 6 studies comparing the PBL-CBL group with the LBL group were included to assess differences in self-learning ability [2, 33, 39,40,41, 43]. The PBL-CBL group outperformed the LBL group in self-learning ability (RR = 1.55, 95% CI: 1.34–1.80, P < 0.0001, I2 = 0%) (Fig. 12F).
Learning interest
A total of 330 students from 5 studies comparing the PBL-CBL group with the LBL group were included to assess differences in learning interest [2, 33, 34, 39, 42]. The PBL-CBL group outperformed the LBL group in enhancing learning interest (RR = 1.35, 95% CI: 1.19–1.53, P < 0.0001, I2 = 0%) (Fig. 13A).

Forest plot of the effect of the PBL-CBL group versus LBL group on (A. learning interest; B. learning efficiency; C. clinical thinking ability; D. team collaboration ability; E. communication and expression abilities; F. CTDI-CV total score)
Learning efficiency
A total of 98 students from 2 studies comparing the PBL-CBL group with the LBL group were included to assess differences in learning efficiency [41, 42]. The PBL-CBL group outperformed the LBL group in improving learning efficiency (RR = 1.59, 95% CI: 1.21–2.10, P = 0.0009, I2 = 4%) (Fig. 13B).
Clinical thinking ability
A total of 212 students from 4 studies comparing the difference between the PBL-CBL group with the LBL group were included to assess differences in clinical thinking ability [2, 33, 41, 42]. The PBL-CBL group had a higher clinical thinking ability rate than the LBL group (RR = 1.47, 95% CI: 1.25–1.72, P < 0.0001, I2 = 0%) (Fig. 13C).
Team collaboration ability
A total of 308 students from 5 studies comparing the PBL-CBL group with the LBL group were included to assess differences in team collaboration ability [33, 34, 36, 39, 42]. The PBL-CBL group outperformed the LBL group in team collaboration ability (RR = 1.86, 95% CI: 1.54–2.25, P < 0.0001, I2 = 16%) (Fig. 13D).
Communication and expression abilities
A total of 172 students from 4 studies comparing the PBL-CBL group with the LBL group were included to assess differences in communication and expression abilities [33, 39, 40, 43]. The PBL-CBL group demonstrated better communication and expression abilities than the LBL group (RR = 1.41, 95% CI: 1.19–1.66, P < 0.0001, I2 = 0%) (Fig. 13E).
CTDI-CV total score
A total of 162 students from 2 studies comparing the PBL-CBL group with the LBL group were included to assess differences in CTDI-CV total score [30, 37]. The PBL-CBL group had a higher CTDI-CV total score than the LBL group (MD = 31.25, 95% CI: 28.25–34.25, P < 0.0001, I2 = 39%) (Fig. 13F).
Satisfaction with teaching methods
A total of 468 students from 7 studies comparing satisfaction with the teaching methods between the PBL-CBL and LBL groups were included [31,32,33,34,35,36, 42]. The PBL-CBL group showed higher satisfaction with the teaching methods than the LBL group (RR = 1.34, 95% CI: 1.23–1.45, P < 0.0001, I2 = 0%) (Fig. 14).

Forest plot of the effect of the PBL-CBL group versus LBL group on satisfaction with teaching methods
link


